Learning from benchmarking: fundraising trends & success factors for nonprofits in Australia & New Zealand
The pandemic years were challenging for fundraisers everywhere as in-person activities came to an abrupt halt in an environment of already challenged fundraising with rising costs, declining retention and increased competition for funding.
In New Zealand and Australia, as elsewhere, many nonprofits joined forces to find solutions, and out of this came The Benchmarking Project, cofounded by Fi McPhee, Peter Coleman, Paul Tavatgis and Adam Watson.
“A lot of charities were experiencing the same issues,” Fi says. “Charities were asking what we as a sector could do and one of the main things that came out of that from fundraisers was that we needed benchmarking. We found some initial advisors, some amazing fundraisers and leaders, and said let’s do it.”
Three years later, and The Benchmarking Project has some 200 members – a mix of charities, consultants and agencies. Around 55 charity members supply their data annually, helping not just their own organisations but the sector as a whole through the insights gained.
Benchmarking practicalities & metrics for success
Participating charities are asked to provide ‘everything’ – which in practice means at least 10 years of all transactional individual giving data with as much information as is available. The Benchmarking Project’s analysts then classify it “so we can compare apples with apples”.
This, Fi adds, is a useful practice in itself: identifying for members where their structure, classifications, or coding are letting them down, and helping them work out where they need to invest in better data.
As a result, the programme is “the one place charities can see their whole programme analysed accurately, and with the kind of metrics they want to see but that their systems or teams simply can’t create.”
Getting the metrics right for meaningful analysis is critical for successful fundraising, says Fi, but it’s an area nonprofits often struggle with.
“Fundraising is an investment. It’s about the value of a programme into the future. So it’s not just about the average gift last year, but looking at how it’s growing; at lifetime value, and retention and how they’re growing; and at the retention and returns of different cohorts – so not just rates of new donors, but how well we’re retaining our long-term or higher value donors.”

Each organisation that provides data receives their own analysis and benchmarking against the sector, while an industry level report on the trends goes out to all members, with some elements shared publicly to help the wider sector.
This data reveals a great deal about fundraising trends and challenges in Australia and New Zealand, and provides valuable insight into common factors between the most successful organisations.
Challenges & trends in giving
Similar in many ways, the biggest difference between these two Commonwealth countries is size, with around 26mn people in Australia and 5mn in New Zealand. Both are mature fundraising markets, with The Benchmarking Project’s analysis showing Australia ahead on use of digital while, alongside lower average gifts and less channel diversification, there is stronger growth and retention in New Zealand.
Overall, fundraising in both countries has seen over 25% five-year growth in income, but with little movement in individual giving last year. Retention rates continue to decline slowly across all donor cohorts, and there is evidence that the rising cost of living is impacting giving with the data revealing the younger the donor or the lower the socio-economic ranking, the less likely a profitable return.
Single gifts are also on the rise post-pandemic, after several years of decline. Benchmarking shows strong response to the ever-increasing number of emergencies, and increasing income from peer-to-peer fundraising, but most often this is a one-off donation, and with the latter at least, the amount can be relatively small.
“Emergency donors are emotionally motivated: it’s about the impact not the organisation. This means second gift rates and repeat giving is half compared to non-emergency givers,” says Fi.
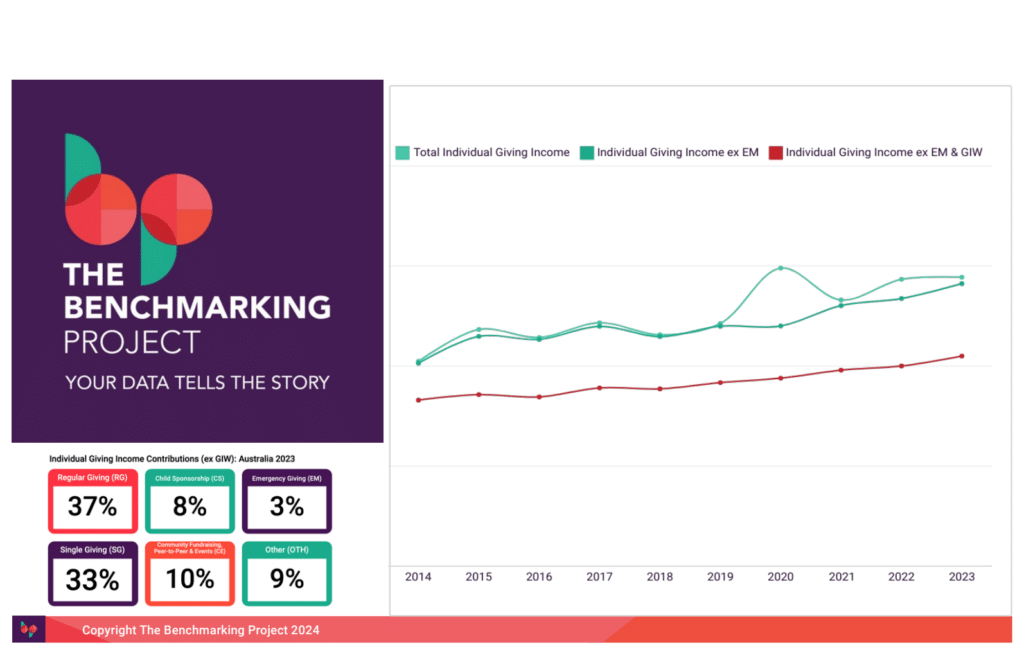
“In addition, in Australia we recruit as many new community fundraising and peer to peer donors as we do monthly and single givers combined, but they deliver only 9% of revenue and just 5% or so will ever give again. Single and monthly giving is around of 55% of revenue by comparison, with a much better lifetime of eight years of giving.”
Over in New Zealand, nonprofits have had another issue: cheques were withdrawn in 2021, and with notable impact as Fi explains:
“For our traditional charity giving market, predominantly 65-plus females, cheques were a main way of giving to their favourite causes. As a result, we’ve lost a cohort of donors that had higher retention than those giving through any other payment method because many haven’t found a way to keep giving. The impact of this will be felt for years as these donors were the most likely to be retained and grow in value.
“However, we were also worried direct mail appeals were going to fall off the perch and they haven’t. They’ve been held up by mid-value donors, and overall average gifts are rising.”
Australia is set to follow suit with cheque discontinuation by 2030, but nonprofits there at least have the chance to learn from New Zealand’s experiences, while there is already greater adoption of digital payment methods.
Trends in acquisition
In a bid to find new supporters, many nonprofits are focusing on quality over quantity and testing across and within channels. The data shows it continues to be the older donors with the most to offer.
“We can see that with monthly giving we lose the younger donors quickly, simply because they don’t have the disposable income. The older the donor the higher the retention, and the closer they are to being a good gift in will prospect.”
Increasing costs and changing giving habits are also impacting where nonprofits are spending on acquisition, with more going on digital. Fi notes: “If we go back to 2014-15, we were recruiting three times more donors through direct mail than now. Face-to-face is also more difficult – 15 years ago, the breakeven on a programme was maybe 14 months. It’s pushing past double that now.”
6 common factors for fundraising success & organisational growth
In both countries then, nonprofits are grappling with a number of similar issues, but some are inevitably doing better than others.
So what’s their secret? Fi shares the common denominators revealed by the benchmarking:
- They benchmark and invest in their data management and analytics
“The ones with high growth all have analytics capacity in-house and or outsource to experts
for different areas. They value their data and the insights they gain, and conduct forecast
modelling with a long-term investment mindset.” - There’s interest in fundraising from leadership
“When I present the results to these organisations, the whole team comes including the CEO.
There’s interest in fundraising not just from the fundraising team but from senior leadership,
and an absolute investment and belief in insight as important.” - They have a learning culture
“This is about learning from and celebrating failures as much as success. So many of these
organisations will have innovation or testing budgets that don’t have a return applied to
them and they’ll be reporting back on those learnings.” - They don’t focus on the cost of fundraising
“Fundraising and admin have impact just as much as someone planting trees or doing medical research. The more successful growth organisations are the ones who are not using cost of fundraising or ROI as they key measure of success. They’re proud that they spend to create money and they measure the impact of this investment over the long-term.” - They focus on lifetime value
“Fundraising is an investment, and in these pressured times in particular, growth is coming from the development of existing donors, not from acquisition. The most stable programmes are those continually working to keep retention stable and drive-up average gifts and gifts per donor. They also tend to have higher donor contactability and a focus on higher value donors as their first priority.” - They’ve got their backend sorted
“What impacts retention the most is your backend. When fundraisers aren’t involved in database migration, swathes of donor history can be lost and functionality is not built to support managing the donor experience. This can make the difference between losing donors because you don’t have the data to know they’ve been giving for 50 years, and dramatically reducing inbound cancellations because you do.”